Web UI
The flow web subcommand — workflows overview, jobs list, run history, DAG flowchart, and restart-from-failed-step.
Run flow web from any host that can reach your RunLog backend.
The CLI launches a FastAPI server on 127.0.0.1:8080 by default
with no bearer-token requirement on loopback. For off-host access,
pass --token <value>: every /api/* route (except /api/health)
is then gated on Authorization: Bearer <token>. Binding to a
non-loopback address without a token logs a warning.
pip install "ematix-flow[web]"
flow web --port 8080 --module pipelines
# open http://127.0.0.1:8080/
The --module flag (repeatable) pre-imports a pipelines module so
the UI can render schedules, next-run times, and the DAG view
immediately — without waiting for a scheduler tick to populate
rich-history.
The SPA matches this site’s phosphor-CRT (Carolina-teal) theme. Four top-level views — Workflows, Jobs, Runs, and DAG — plus a per-run detail page.
Workflows — named groupings with inline DAG
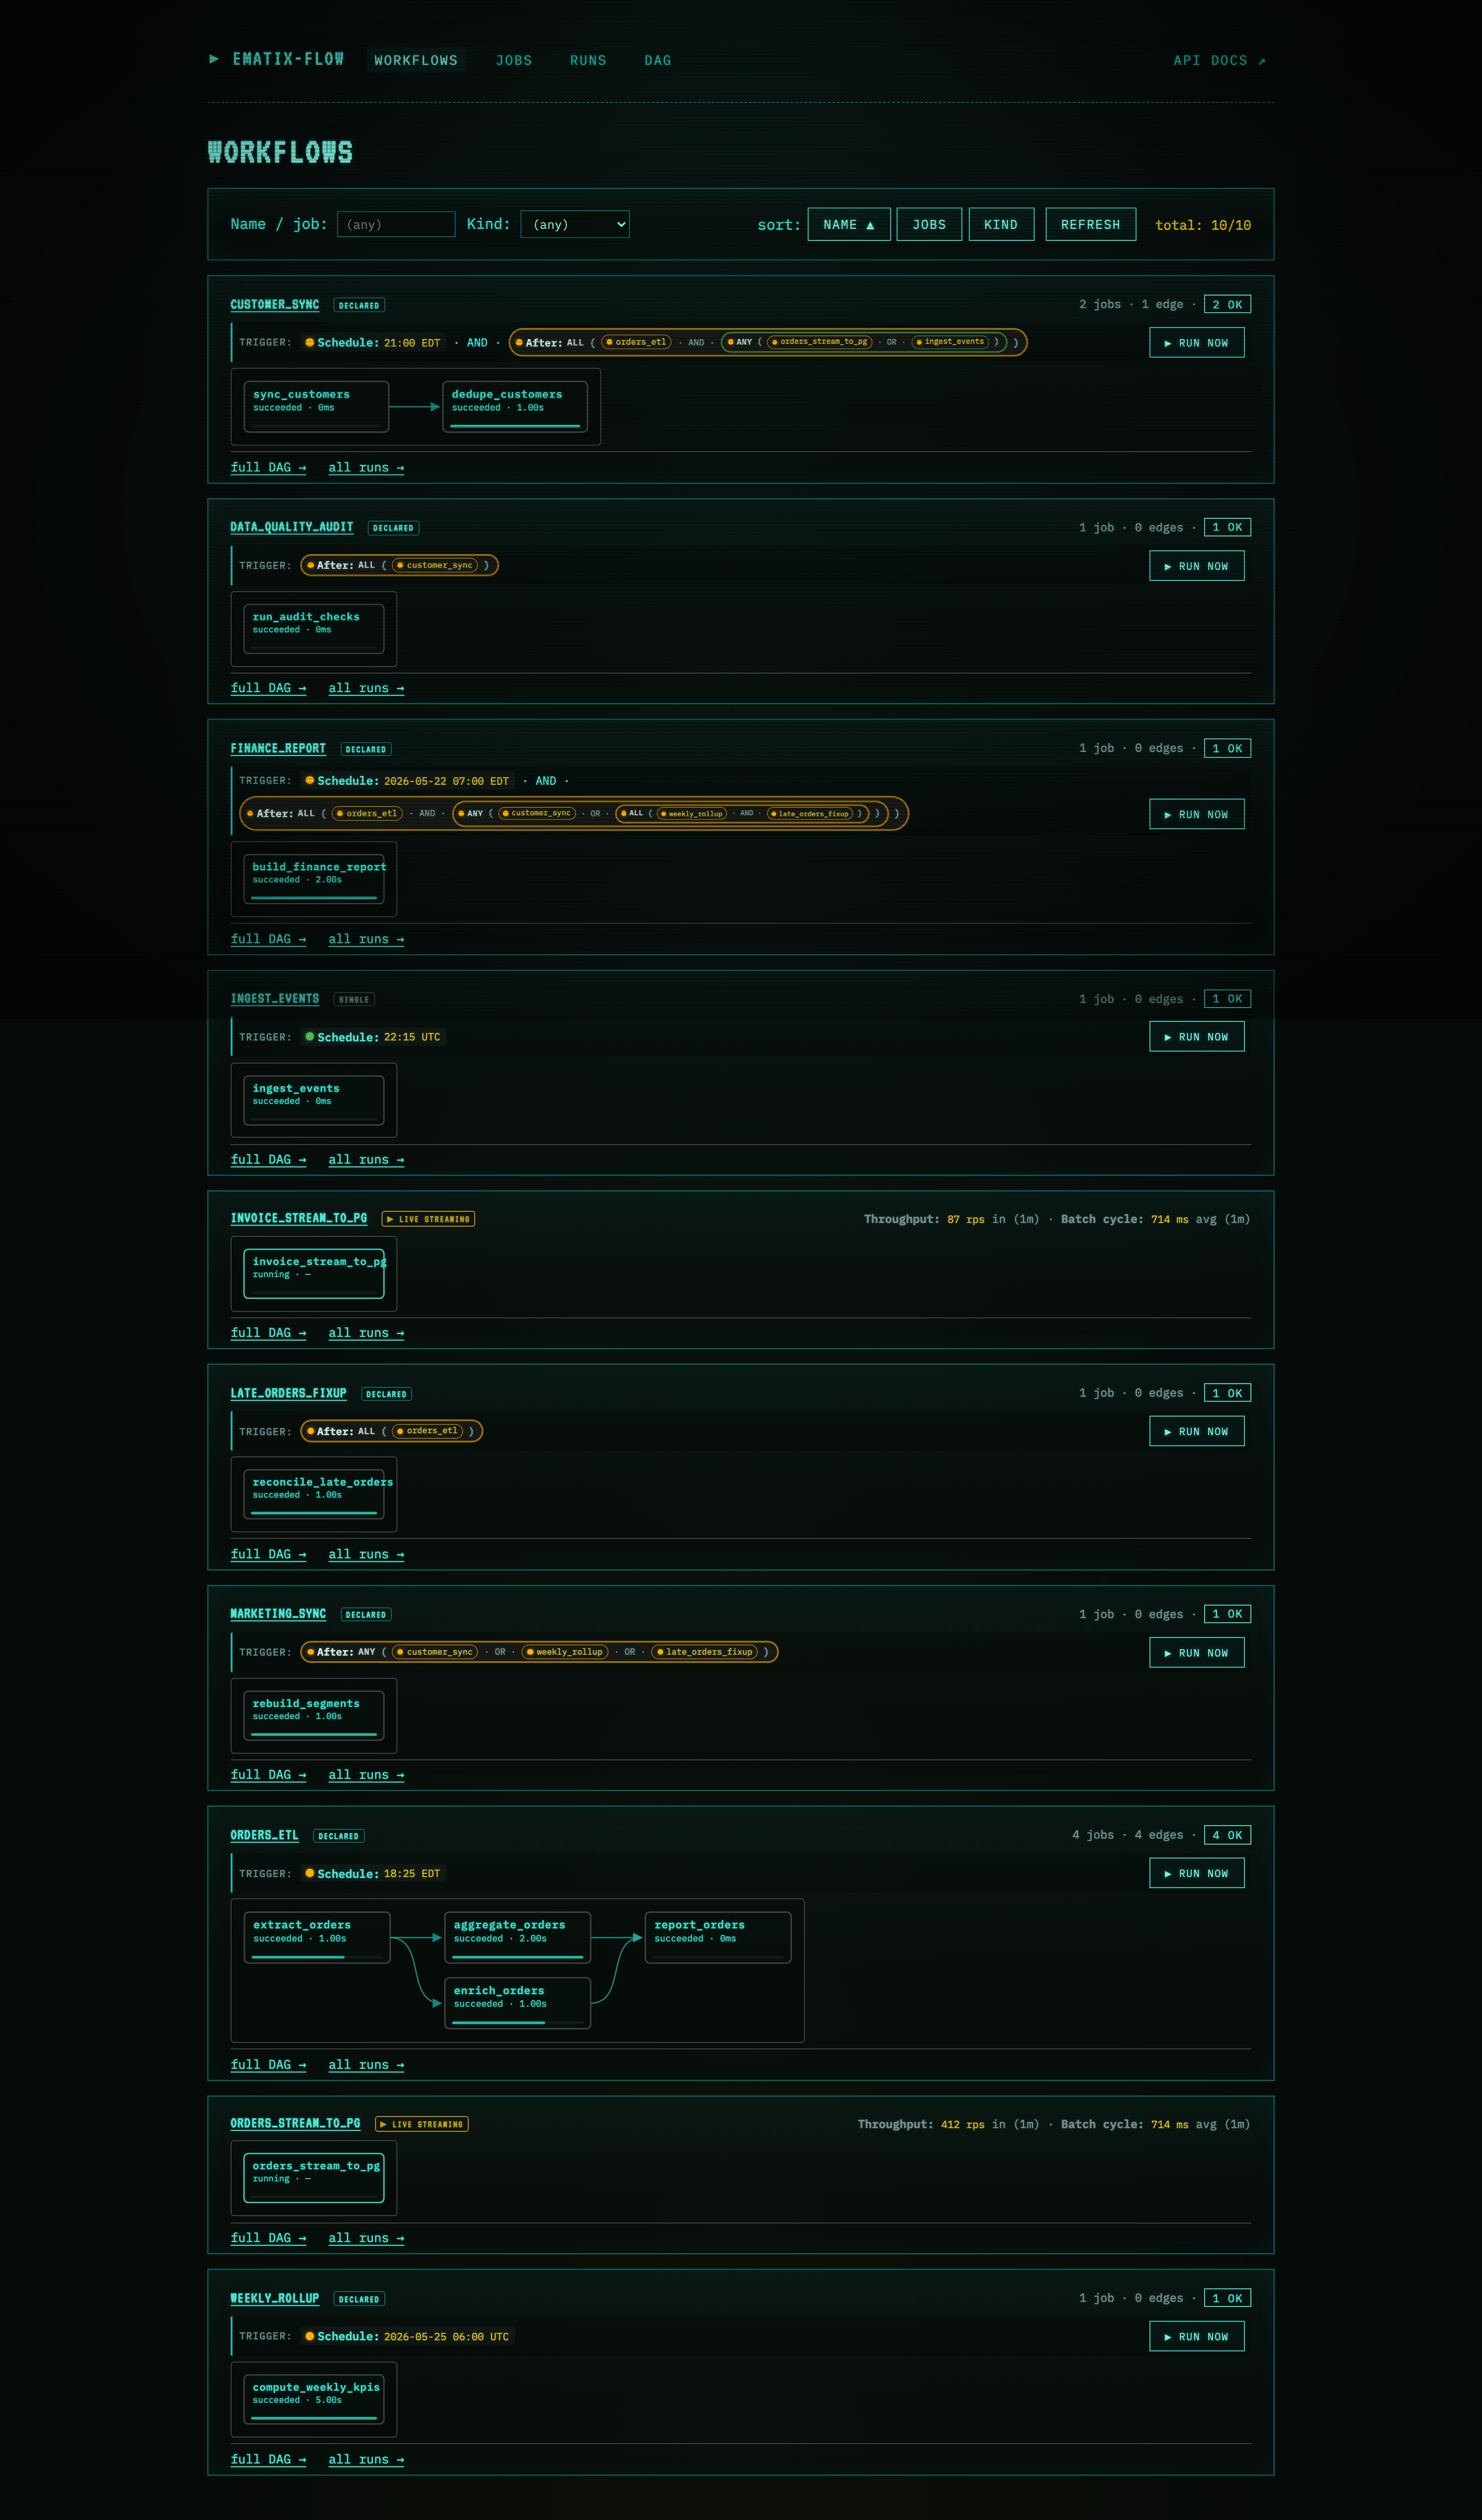
The default landing page is per-workflow. Each card shows the workflow name, a trigger summary line (cron / after / on-message), member-job count, edge count, status summary, and an inline SVG flowchart laying out the member jobs left-to-right with arrows on every DAG edge. Reading the example:
- The
orders_etlworkflow has four jobs in a diamond:extract_ordersruns first;enrich_ordersandaggregate_ordersrun in parallel after extract;report_ordersjoins them. Trigger line reads “Schedule: */5 * * * * America/New_York”. customer_syncdemonstrates a composite trigger — “After: orders_etl · Schedule: 0 21 * * *”. The workflow fires only whenorders_etlhas succeeded AND the 21:00 tick has reached, both measured against this workflow’s own last successful run.- Each node carries a status pill (
succeeded/running/failed/paused), the latest-run duration, and a horizontal duration bar sized relative to the slowest node in the workflow. - Jobs not assigned to any declared workflow show up as
kind: "single"cards. Streaming pipelines show the▶ LIVE STREAMINGpill instead of a trigger line. - Click any node → the focused DAG view (
#/dag/<job>). Click the workflow title → same.
This view exists to answer “what runs together?” at a glance.
Jobs — every individual job, filtered and sorted
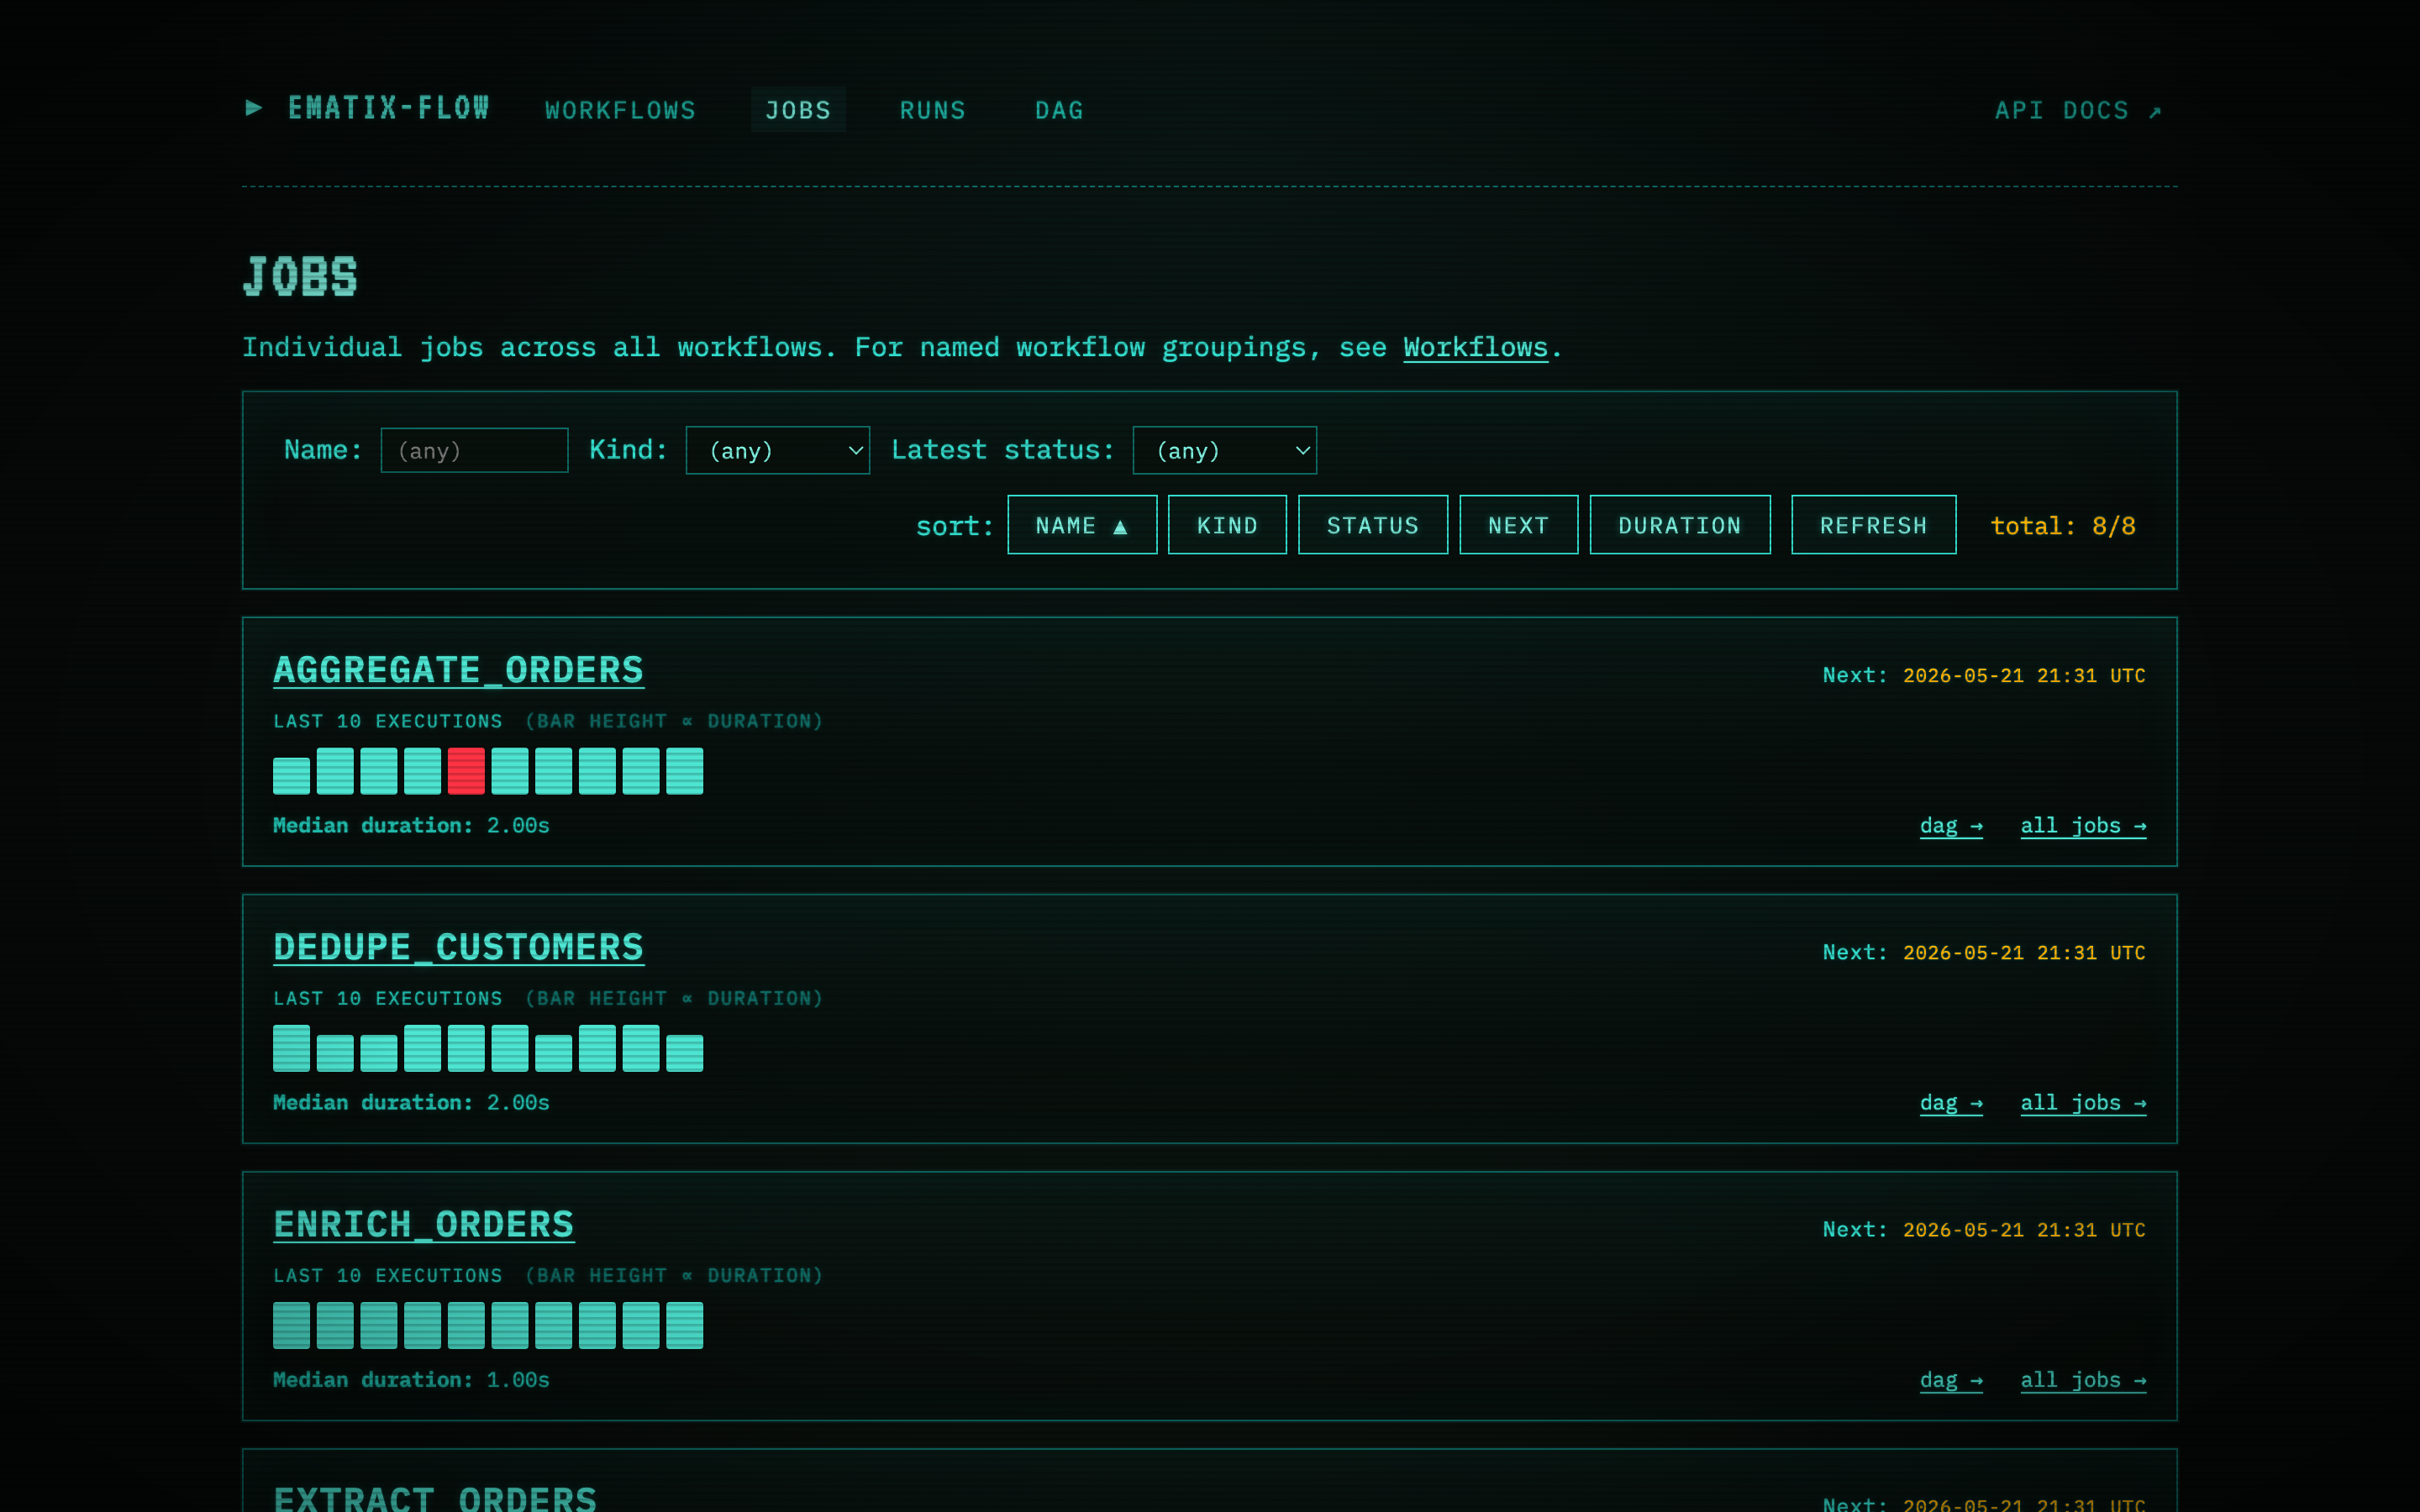
The Jobs tab is the flat list of every individual job in the project — useful when you want to scan one specific job, regardless of which workflow it belongs to. Same cards as the previous “Pipelines” page:
- Name + kind of the job.
- Last-10 execution strip — one colored bar per execution, oldest left → newest right. Teal = succeeded, red = failed, amber-pulse = running, dashed = no run yet. Bar height encodes duration with a square-root curve so a single outlier doesn’t flatten the rest of the strip.
- Next:
<UTC>for batch jobs (rendered in the job’s configuredtimezone=when set), or LIVE STREAMING for streaming consumers. - For batch: median duration + a link into Runs filtered to that job. For streaming: a live Throughput X rps in (1m) / Y rps in (5m) · Batch cycle: A ms avg (1m) footer.
New in v0.6.0 — filter inputs (name substring / kind / latest status) and sort buttons (name / kind / status / next / duration). Clicking any square in the last-10 strip drills into that run’s detail page.
Runs — every execution record in a flat table
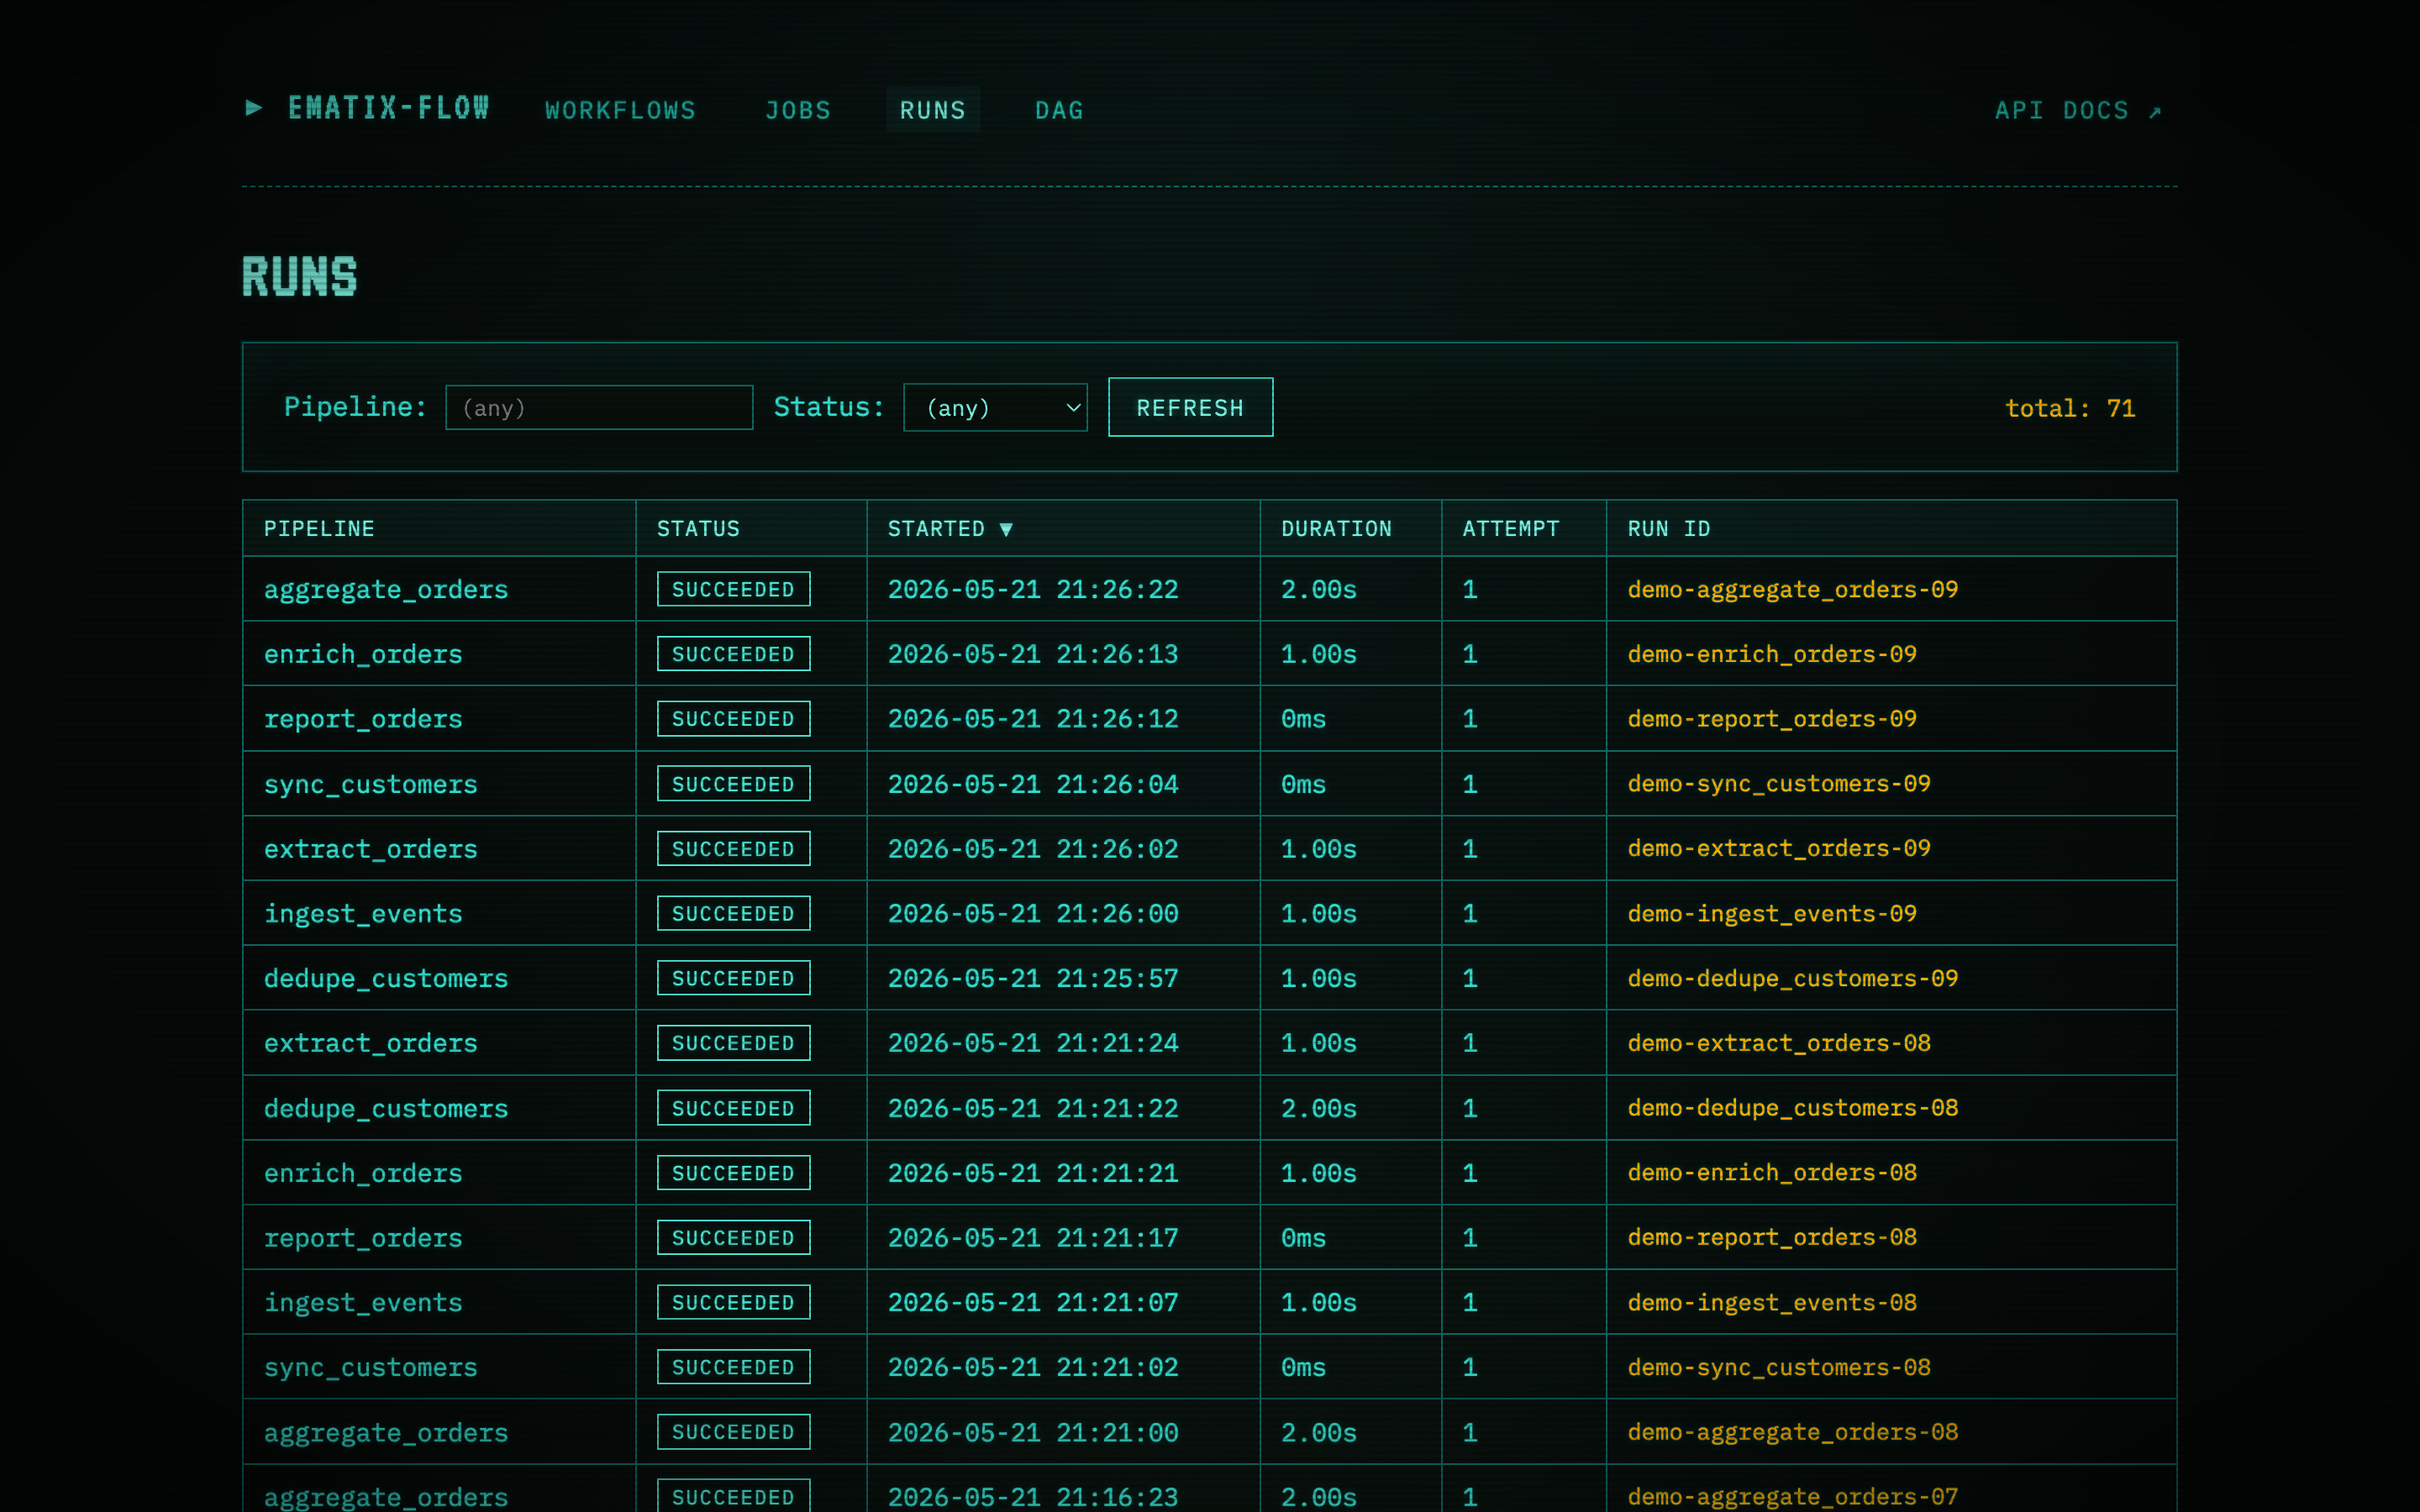
When you need to scan recent failures across every job at once, the Runs tab is a flat table of every run record. Status pill, job name, started/finished timestamps, attempt count, duration, and the failed step (if any) all sit in the row. Column headers are clickable to sort by pipeline / status / started / duration / attempt. Clicking a row opens that run’s detail page.
(Previous versions called this view “Jobs” — the rename to Runs matches the v0.6.0 terminology where a “Job” is the unit of work and a “Run” is one execution of it.)
DAG — full cross-job flowchart with arrows
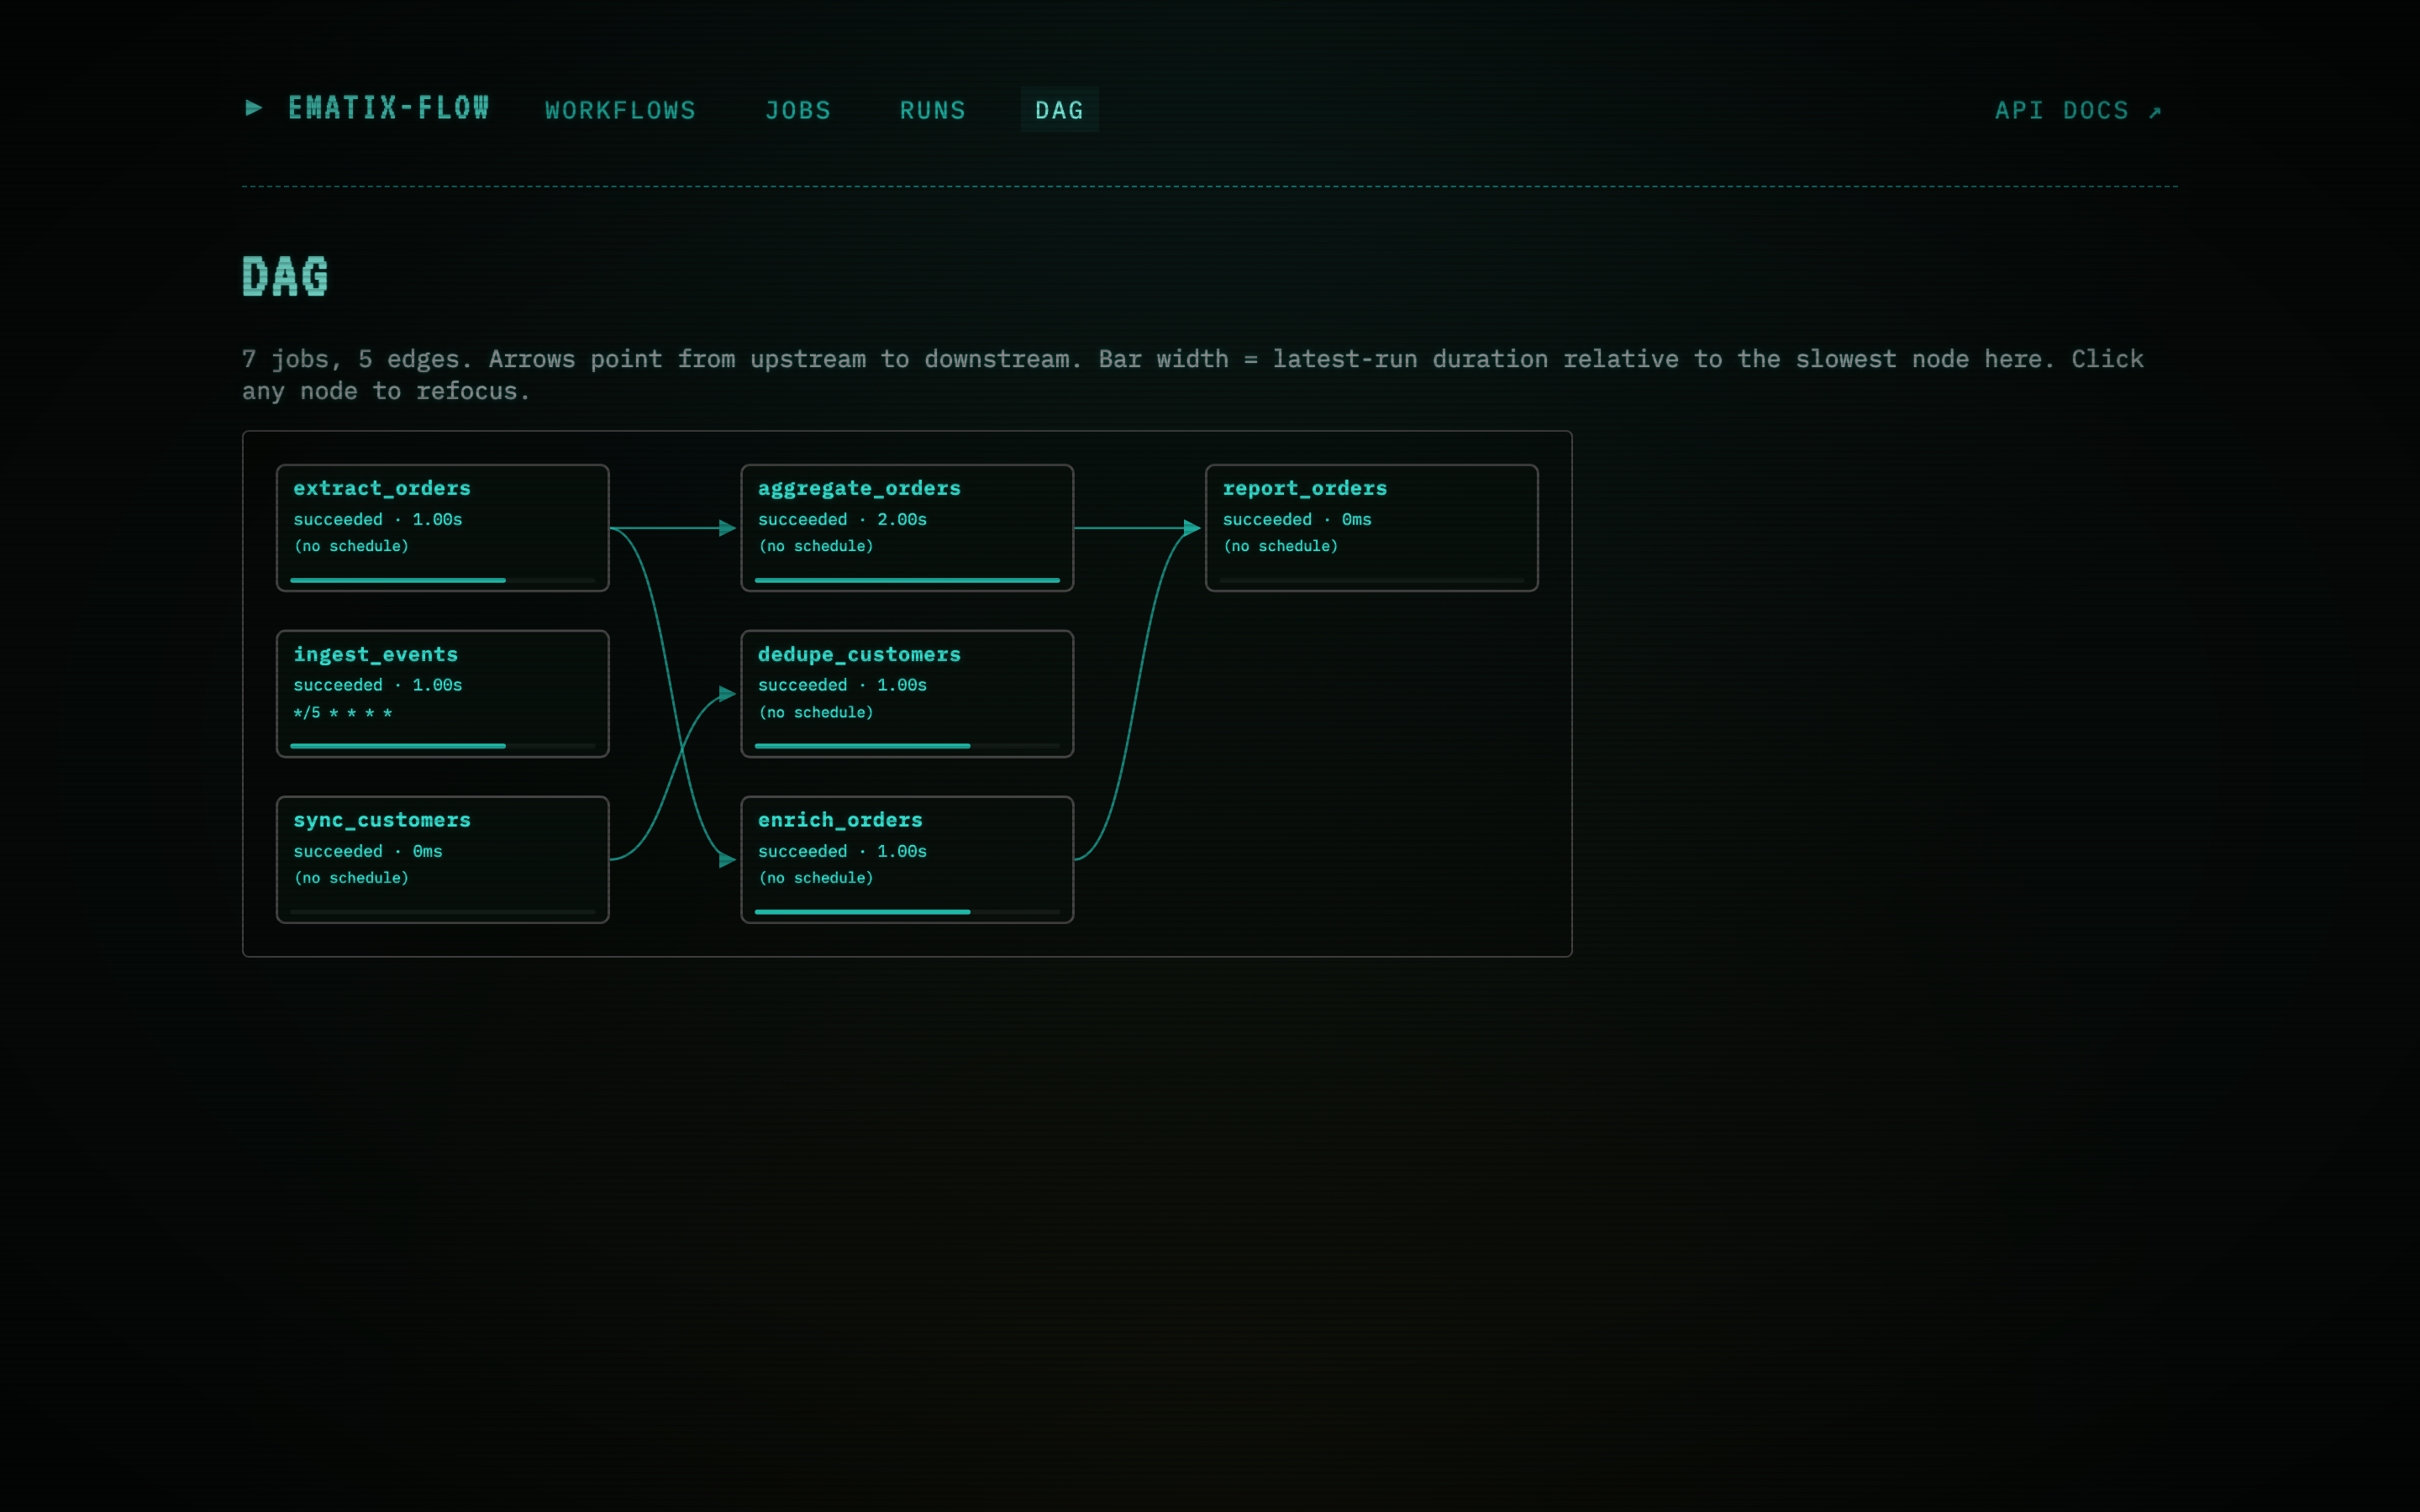
The DAG view (#/dag) renders every dependency edge in the
project as an SVG flowchart with cubic-Bézier arrows pointing from
upstream to downstream. The rank-as-column layout from earlier
versions is gone — topological order is now expressed by arrow
direction, not implied by column position.
Each node shows:
- Name of the job.
- Status pill + latest-run duration below the name.
- Schedule (cron expression) at the bottom.
- Duration bar along the bottom edge, sized relative to the slowest node currently visible.
#/dag/<job-name> focuses the subgraph on a single job’s ancestors
- descendants, so you can answer “what does this job depend on, and what depends on it?” without scanning the full graph.
Failed nodes get a red border. Running nodes get a green pulse border. The focused node gets a phosphor-bright border + slight shadow. Hover any node to see the full schedule / status / duration tooltip.
This view is useful for:
- Spotting orphan jobs (no upstream, no downstream — easy to forget when the project grows).
- Catching unintended cycles before they fail at registration time.
- A one-screen answer to “what runs after
extract_orders?” without grepping decorator kwargs.
Failed run — Restart from failed step highlighted
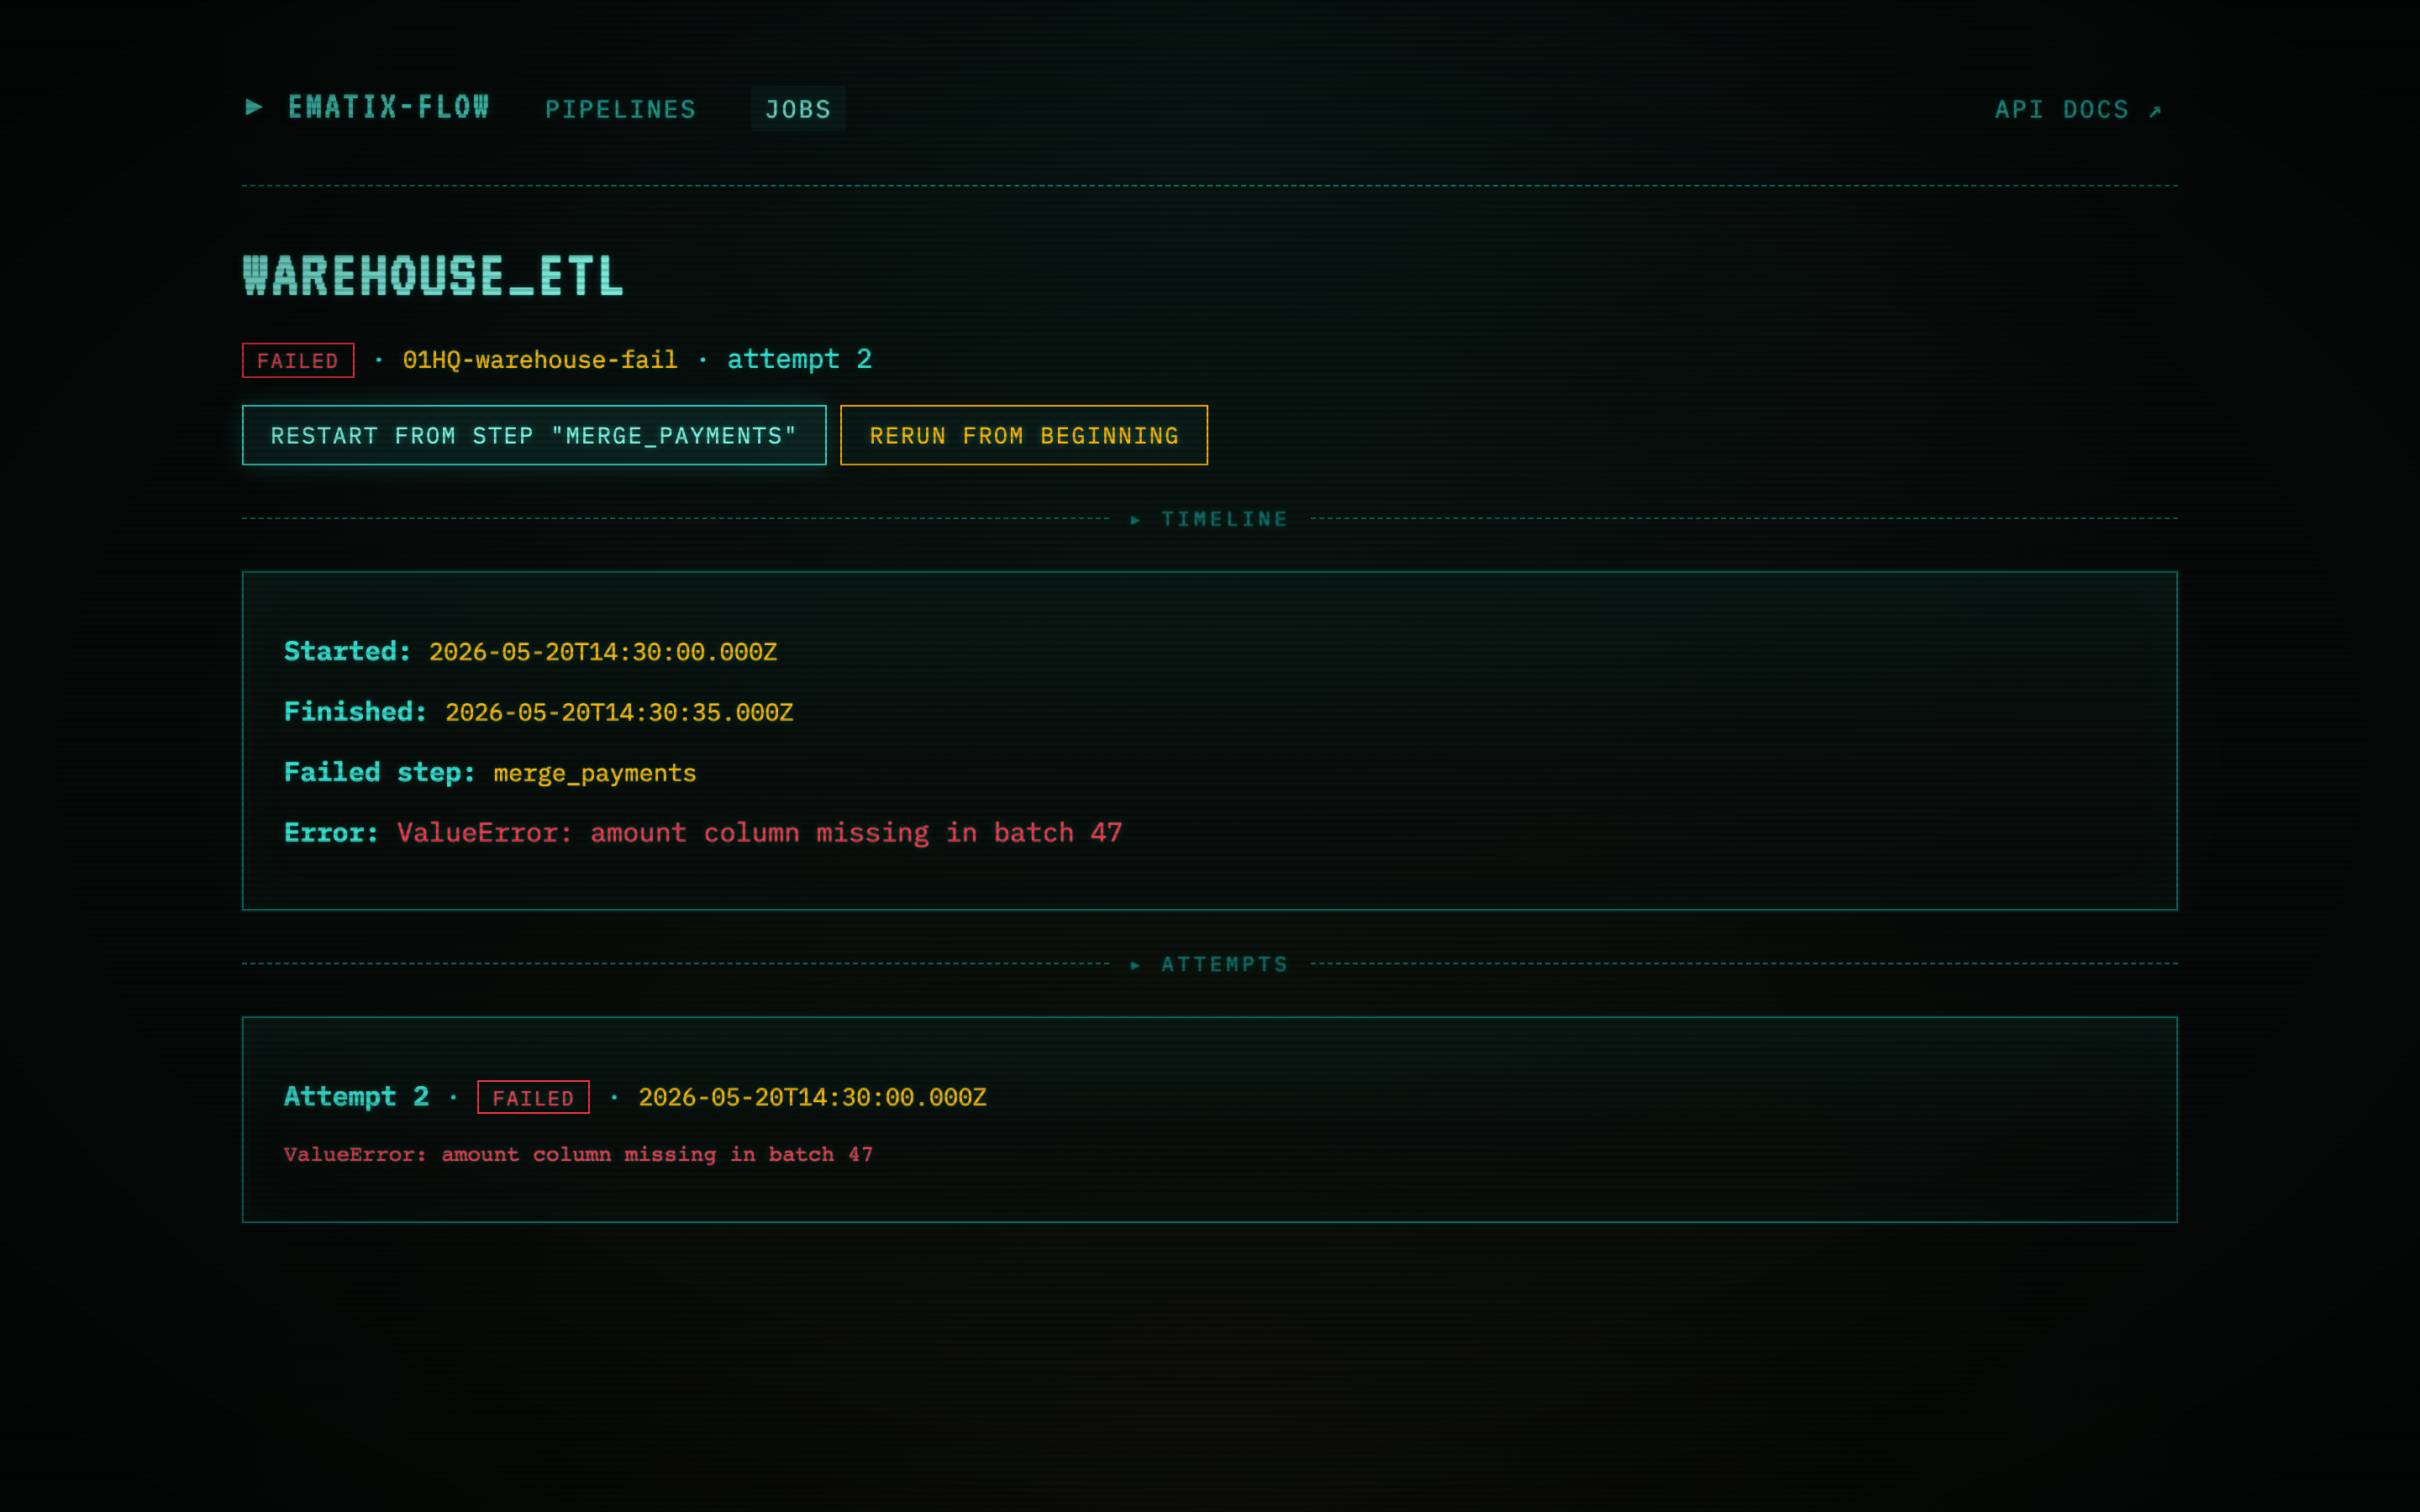
A run that hit an error mid-DAG. The detail page exposes the exact
step that failed (merge_payments), the error
(ValueError: amount column missing in batch 47), and the full
retry history (two attempts, both failing on the same step).
The RESTART FROM STEP “merge_payments” button is one of two
restart actions surfaced on a failed batch run. Clicking it POSTs
to /api/runs/<run_id>/restart with
{ "from_step": "merge_payments" }. The scheduler picks up the new
“requested” row on its next tick (default 10s) and the worker
resumes the DAG from merge_payments — load_orders’s output is
reused, so the re-run is the failed step plus everything
downstream, not the whole job.
The RERUN FROM BEGINNING button next to it kicks off a fresh run from scratch — useful when the source data has changed or the failure was non-deterministic.
For streaming runs, the same button reads RESUME FROM WATERMARK instead and resumes from the last committed watermark rather than a discrete step. Rerun from beginning is available on any terminated run.